Figure 2
YouTube Reach Planner
Models a YouTube buy before it is booked. Pick a market, a flight length and a mix of ad products, and it returns the reach, frequency and cost that budget produces — then marks the point where the money stops working.
- Shipped
- Status
- live
- Runs on
- the operator console
Answers
At this budget, is the next rupee still worth spending here?
Running
Splitting one budget across two markets
The same argument decides allocation. Neither an even split nor a split in proportion to population is right; the best split is the one where the next person costs the same in both markets. Move the slider and the shortfall against that optimum is printed underneath.
One budget of ₹1.5 crore across two markets: a metro of 1.2 crore reachable people where the first person costs ₹1.80, and a tier-2 cluster of 45 lakh where the first costs ₹1.10.
| Market | Next person | Budget | Reached |
|---|---|---|---|
| Metro | ₹2.55 | ₹75 lakh | 35.2 lakh |
| Tier-2 cluster | ₹5.01 | ₹75 lakh | 35.11 lakh |
| Total | — | ₹1.5 crore | 70.31 lakh |
- Metro
- Next person
- ₹2.55
- Budget
- ₹75 lakh
- Reached
- 35.2 lakh
- Tier-2 cluster
- Next person
- ₹5.01
- Budget
- ₹75 lakh
- Reached
- 35.11 lakh
- Total
- Budget
- ₹1.5 crore
- Reached
- 70.31 lakh
A model, computed in your browser from the parameters printed above it, which you can change. The instrument itself signs in against a live account; nothing on this page touches one.
Question
A forecast is easy. Knowing where to stop is the job.
Any planning tool will tell you what a budget reaches. The figure always goes up with spend, so on its own it can justify any number at all. The question a planner has to answer in front of a client is the other one: at this budget, is the next rupee still worth spending here?
This instrument answers that by computing, at every modelled point on the curve, what the next person actually cost — the extra spend divided by the extra people reached — and putting that figure beside the reach figure rather than underneath it.
Method
How the knee is found
step one
For every step along the curve, divide the extra spend by the extra people reached. That is what the next person cost at that point.
step two
Take the middle value across all of those steps, so one freakish step cannot move the answer.
step three
The knee is the first point, past the step where a person was cheapest, at which the next person costs more than twice that middle value. The recommended band runs from the knee to the last point at which the next person still costs no more than twice what they cost at the knee.
Reported as a range, not a line
Plates
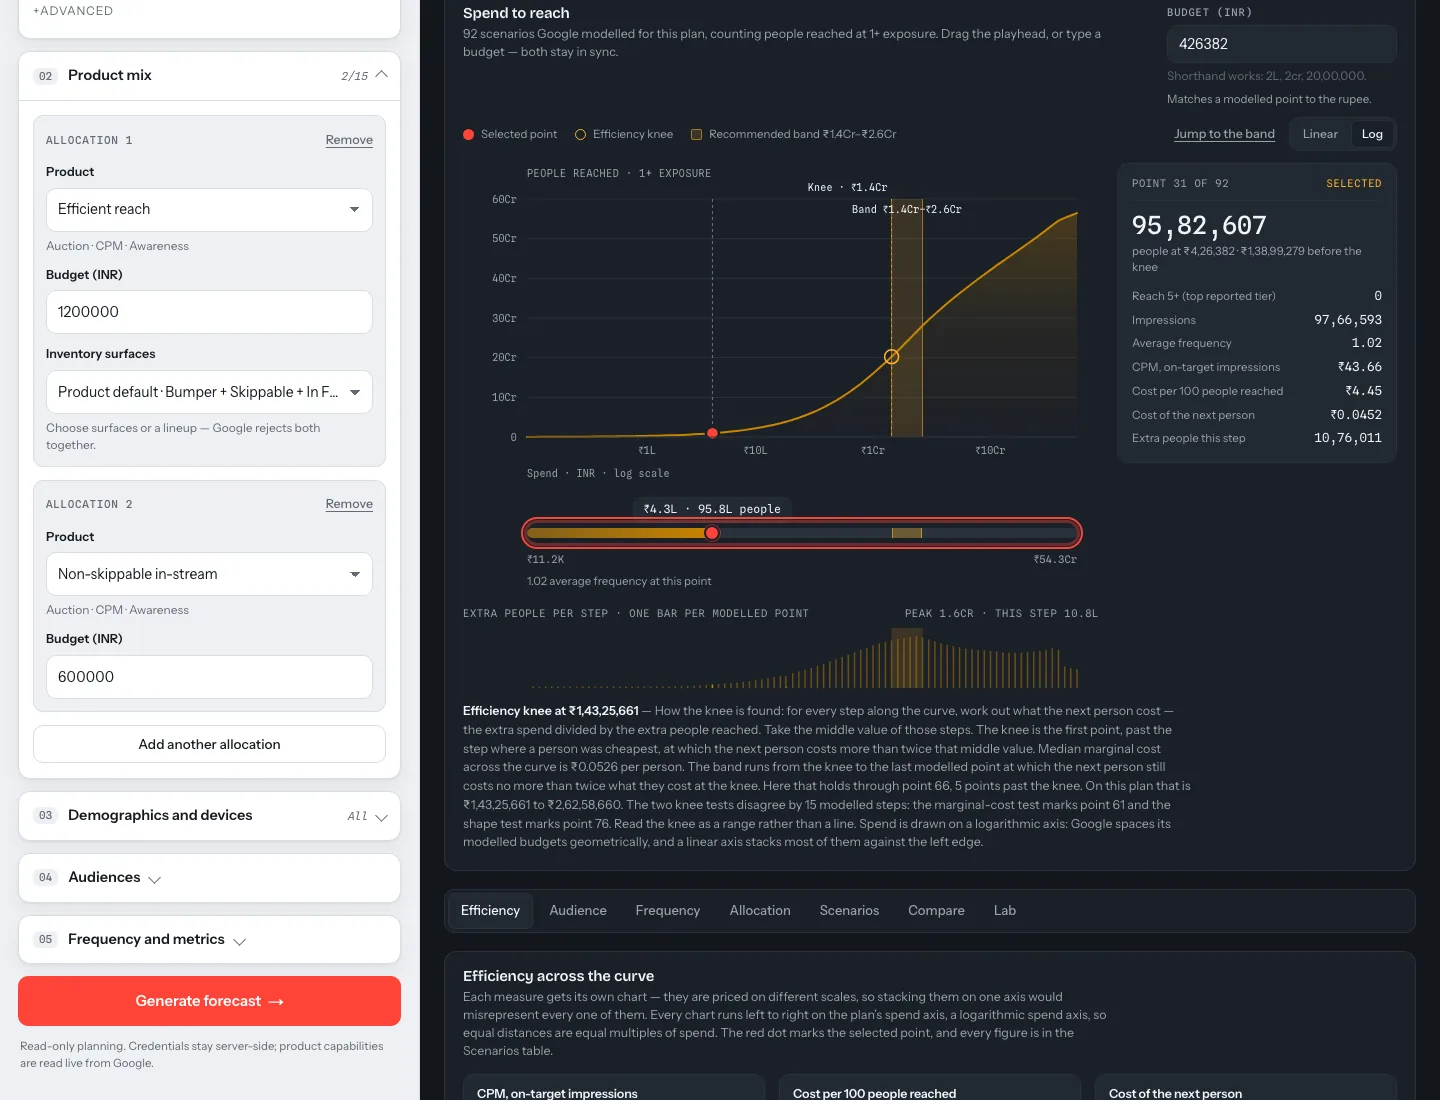
Plate 1
The analysis pane. Spend runs on a logarithmic axis because Google spaces its modelled budgets geometrically, and a linear axis stacks most of them against the left edge.
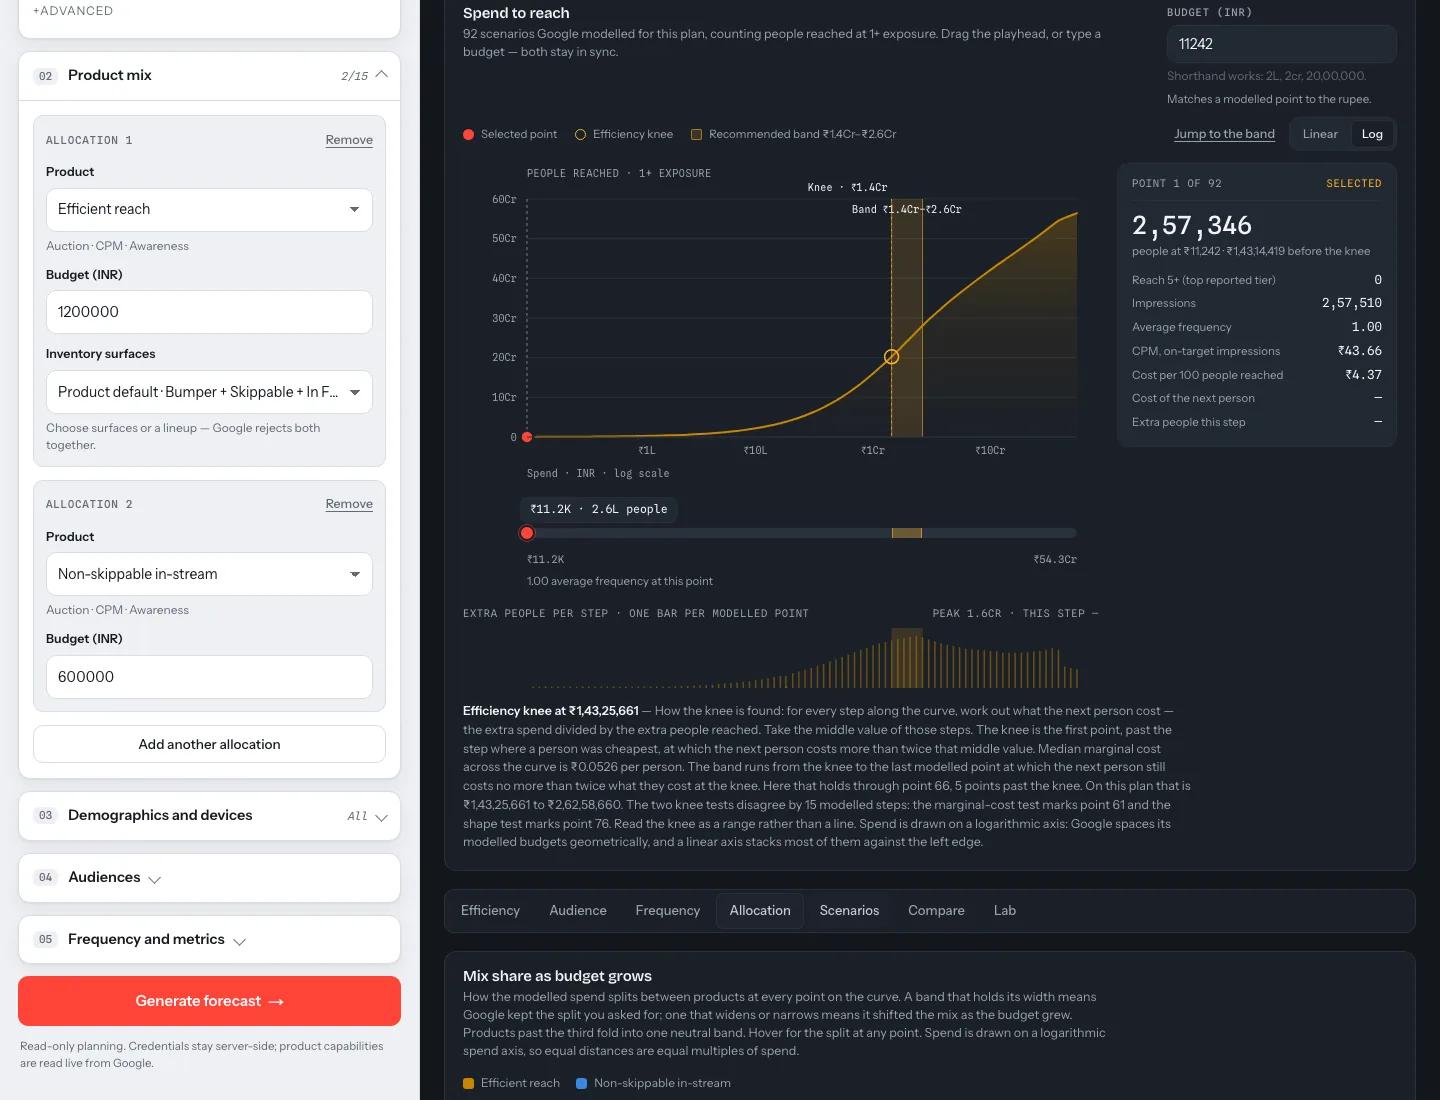
Plate 2
The allocation view: where a plan’s budget goes across ad products, and what each contributes.
Specification
- Answers
- Reads from
- Writes
- Produces
- Also answers
- Access
Access
The running instrument is operated by one person against a live Google Ads account, and is not open to sign-up. Everything on this page — the method, the specification and both demonstrations — is public and is meant to be argued with.